- Food has a different resource cost
- Land is the key environmental resource
- Beef is the least efficient option
- Legumes are the most resource-efficient
- PBMAs are an intermediate but good compromise
- Cultivated meat saves land and water
- Energy is the weak point of lab-grown meat
- The water footprint is highest for beef
- Legumes lead in both calories and protein
- Plant-based options use fewer resources
- The energy source is decisive for the future
- Environmental efficiency depends on food choice
The food we eat affects not only us through the nutrients it contains, but also nature and the planet we inhabit. Leaving aside animal suffering, which is obvious and we will not be the first or the last to point it out, we will focus on the price our small planet pays for our actions and eating habits.
There is a price paid for producing our food and a price paid as a result of that production. The second is most often greenhouse gas and nitrogen emissions, while the first is the use of resources such as land, water and energy. In this article, we will focus on the resources needed to produce what we eat and once again examine how these indicators vary between livestock farming, growing whole-food substitutes, meat imitations and lab-grown meat.
Land use
We begin with land and its use:
Land is the most structurally important environmental variable in food systems because it is directly connected to:
- Deforestation
- Biodiversity loss
- Carbon opportunity cost
- Soil degradation
Conventional meat
We call it that because later we will also look at the kind grown in a laboratory.
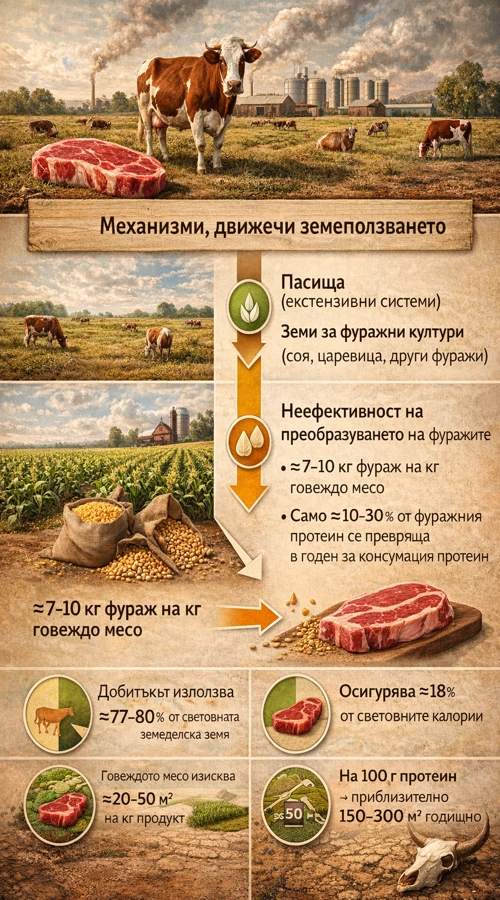
Mechanisms driving land use:
- Pastures — extensive systems
- Land for feed crops — soy, corn, other feed crops
- Inefficiency of feed conversion
Beef protein requires:
- ~7–10 kg of feed per kg of beef
- Only ~10–30% of feed protein is converted into edible protein
Key statistic
- Livestock uses ~77–80% of the world’s agricultural land
- It provides ~18% of global calories
- Beef requires ~20–50 m² per kg of product
- Per 100 g of protein → approximately 150–300 m² per year
Beef is the most land-intensive food in global datasets.
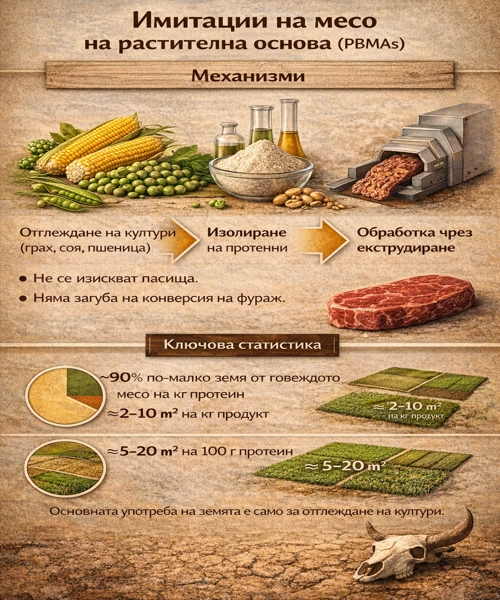
Plant-based meat imitations — PBMAs
Mechanisms:
- Crop cultivation — peas, soy, wheat
- Protein isolation
- Processing through extrusion
No pasture is required.
There is no feed conversion loss.
Key statistic
- ~90% less land than beef per kg of protein
- ~2–10 m² per kg of product
- ~5–20 m² per 100 g of protein
The main land use is simply for crop cultivation.
Whole-food plant-based substitutes — legumes
Mechanisms:
- Direct human consumption
- No feed conversion
- Nitrogen fixation reduces the need for fertilizers
Key statistic
5–20× less land per unit of protein than beef.
Often 2–6 m² per 100 g of protein.
This is the global minimum for land use among protein sources.

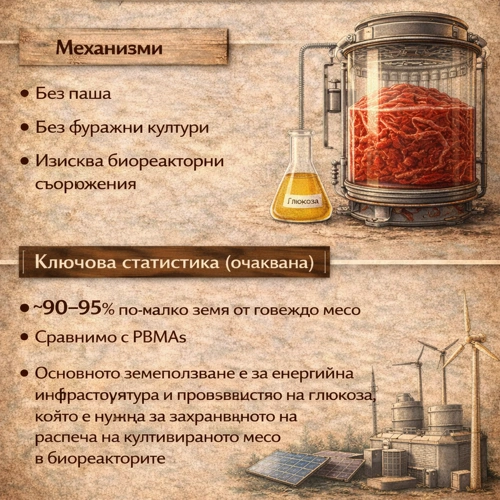
Cultivated — lab-grown — meat
Mechanisms:
- No grazing
- No feed crops
- Requires bioreactor facilities
Key statistic — expected:
- ~90–95% less land than beef
- Comparable to PBMAs
- The main land use is for energy infrastructure and glucose production, which is needed to fuel the growth of cultivated meat in bioreactors
The land required per kilogram of protein is very small.
Water footprint
After land use, it is time to look at how water is used and often wasted in the different production systems.
The water footprint includes:
- Green water — rainfall
- Blue water — irrigation
- Grey water — dilution of pollution
Conventional meat — beef.
Mechanisms requiring water:
- Drinking water
- Irrigation of feed crops
- Processing
Key statistics:
- Beef: 10,000–15,000 liters per kg of product
- Per 100 g of protein → ~5,000–7,000 liters
Most water use comes from irrigation of feed crops.
Whole-food meat imitations
Mechanisms requiring water:
- Crop irrigation
- Processing of raw materials
Key statistics:
- ~75–500 liters per kg of product
- ~200–800 liters per 100 g of protein
~10–20 times lower than beef.
Legumes and peas
Mechanisms:
- Rain-fed crops, often
- Minimal processing
Key statistics:
- ~200–2000 liters per kg
- ~150–500 liters per 100 g of protein
The lowest water footprint among the main protein sources.
Cultivated meat
Mechanisms requiring water:
- Cooling bioreactors
- Production of growth medium
Expectations:
- Lower than beef
- Probably higher than legumes
- Strongly tied to energy use
The water footprint depends on facility efficiency.
Energy use
Last but not least, we will look at the energy use for producing the four contenders for the title of the least harmful food for nature.
Energy footprint is crucial for:
- The efficiency and development of cultivated meat as an industry
- The intensity of processing
- Climate sensitivity
Beef
Energy is used for:
- Fertilizer production
- Agricultural machinery
- Feed transport
- Slaughter
Moderate energy use, but high methane content dominates the climate footprint. Still, we have to be in opposition to it.
Whole-food meat imitations
Energy-intensive stages:
- Protein isolation
- Extrusion
- Processing
Higher than legumes.
Still a much lower overall climate footprint than beef.
Cultivated meat
The highest direct energy demand — bad news.
Energy is needed for:
- Sterile environment
- Continuous bioreactor operation
- Temperature control
- Medium sterilization
If fossil fuels are used, the climate footprint rises sharply.
If renewable energy is used, emissions could be greatly reduced.
The energy source determines the viability of this type of product.
Whole-food meat substitutes
The lowest energy use:
- Mainly harvesting
- Drying
- Minimal processing
The most efficient system overall, but not because we are biased. In other words, that is just how things turned out.
Statistics
To make the comparisons easier to understand, we will also show you some statistics in the form of our favorite tables.
First, we will start with tables showing how much land, water and energy are used to produce 100 grams of protein from each of the four types of products:
Beef
| Indicator | Use for 100 g of protein |
| 🌍 Land use | 150–300 m²·per year |
| 💧 Water use | 5,000–7,000 liters |
| ⚡ Energy use | 40–60 MJ |
Plant-based meat alternatives — PBMAs
| Indicator | Use for 100 g of protein |
| 🌍 Land use | 5–20 m²·per year |
| 💧 Water use | 200–800 liters |
| ⚡ Energy use | 15–35 MJ |
Legumes — beans, lentils, pulses
| Indicator | Use for 100 g of protein |
| 🌍 Land use | 2–6 m²·per year |
| 💧 Water use | 150–500 liters |
| ⚡ Energy use | 5–15 MJ |
Cultivated — lab-grown — meat
(Modelled, not fully commercial)
| Indicator | Use for 100 g of protein |
| 🌍 Land use | 3–10 m²·per year |
| 💧 Water use | 300–1,000 liters |
| ⚡ Energy use | 60–120 MJ |
Since some people will say that protein is not the only thing that matters, and they will be right to say that, we will also add similar tables for producing 1000 calories, which slightly changes the picture.
Why?
- Meat is rich in protein, but calorie-dense through fat.
- Legumes contain carbohydrates + protein.
- PBMAs often contain added oils.
- Cultivated meat reflects the energy density of meat.
Beef — 1000 kcal ≈ ~400 g beef
|
Indicator |
Use for 1000 kcal |
|
🌍 Land use |
~40–80 m²·per year |
|
💧 Water use |
~4,000–6,000 liters |
|
⚡ Energy use |
~20–30 MJ |
Plant-based meat imitations — 1000 kcal ≈ 400–500 g product
|
Indicator |
Use for 1000 kcal |
|
🌍 Land use |
~5–15 m²·per year |
|
💧 Water use |
~400–900 liters |
|
⚡ Energy use |
~10–20 MJ |
Legumes — 1000 kcal ≈ 350–400 g dry legumes
|
Indicator |
Use for 1000 kcal |
|
🌍 Land use |
~3–8 m²·per year |
|
💧 Water use |
~300–800 liters |
| ⚡ Energy use |
~5–12 MJ |
Cultivated meat — 1000 kcal ≈ similar to beef
|
Indicator |
Use for 1000 kcal |
|
🌍 Land use |
~5–15 m²·per year |
|
💧 Water use |
~500–1200 liters |
|
⚡ Energy use |
~40–70 MJ |
And the food-efficiency competition in terms of resource consumption for protein and calories ends as follows:
Overall ranking for environmental efficiency
For producing 100 g of protein:
- Legumes
- PBMAs
- Cultivated meat — if powered by renewable energy
- Beef
Per 1000 kcal:
- Legumes
- PBMAs
- Cultivated meat
- Beef
Sources:
https://www.science.org/doi/10.1126/science.aaq0216
https://ourworldindata.org/environmental-impacts-of-food
https://ourworldindata.org/food-choice-vs-eating-local
https://assets.ctfassets.net/hhv516v5f7sj/4exF7Ex74UoYku640WSF3t/cc213b148ee80fa2d8062e430012ec56/Impossible_foods_comparative_LCA.pdf
https://www.frontiersin.org/journals/nutrition/articles/10.3389/fnut.2025.1641234/full
https://www.mdpi.com/2304-8158/12/3/448
https://www.mdpi.com/2071-1050/14/23/16133
https://gfieurope.org/wp-content/uploads/2022/04/CE_Delft_190107_LCA_of_cultivated_meat_Def.pdf
https://www.oecd.org/content/dam/oecd/en/publications/reports/2022/09/meat-protein-alternatives_54e42940/387d30cf-en.pdf
https://www.fao.org/3/a0701e/a0701e.pdf